Historical performance data for all our solar projects by year
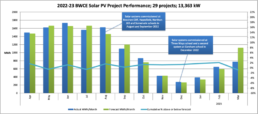
BWCE Projects 2022-23
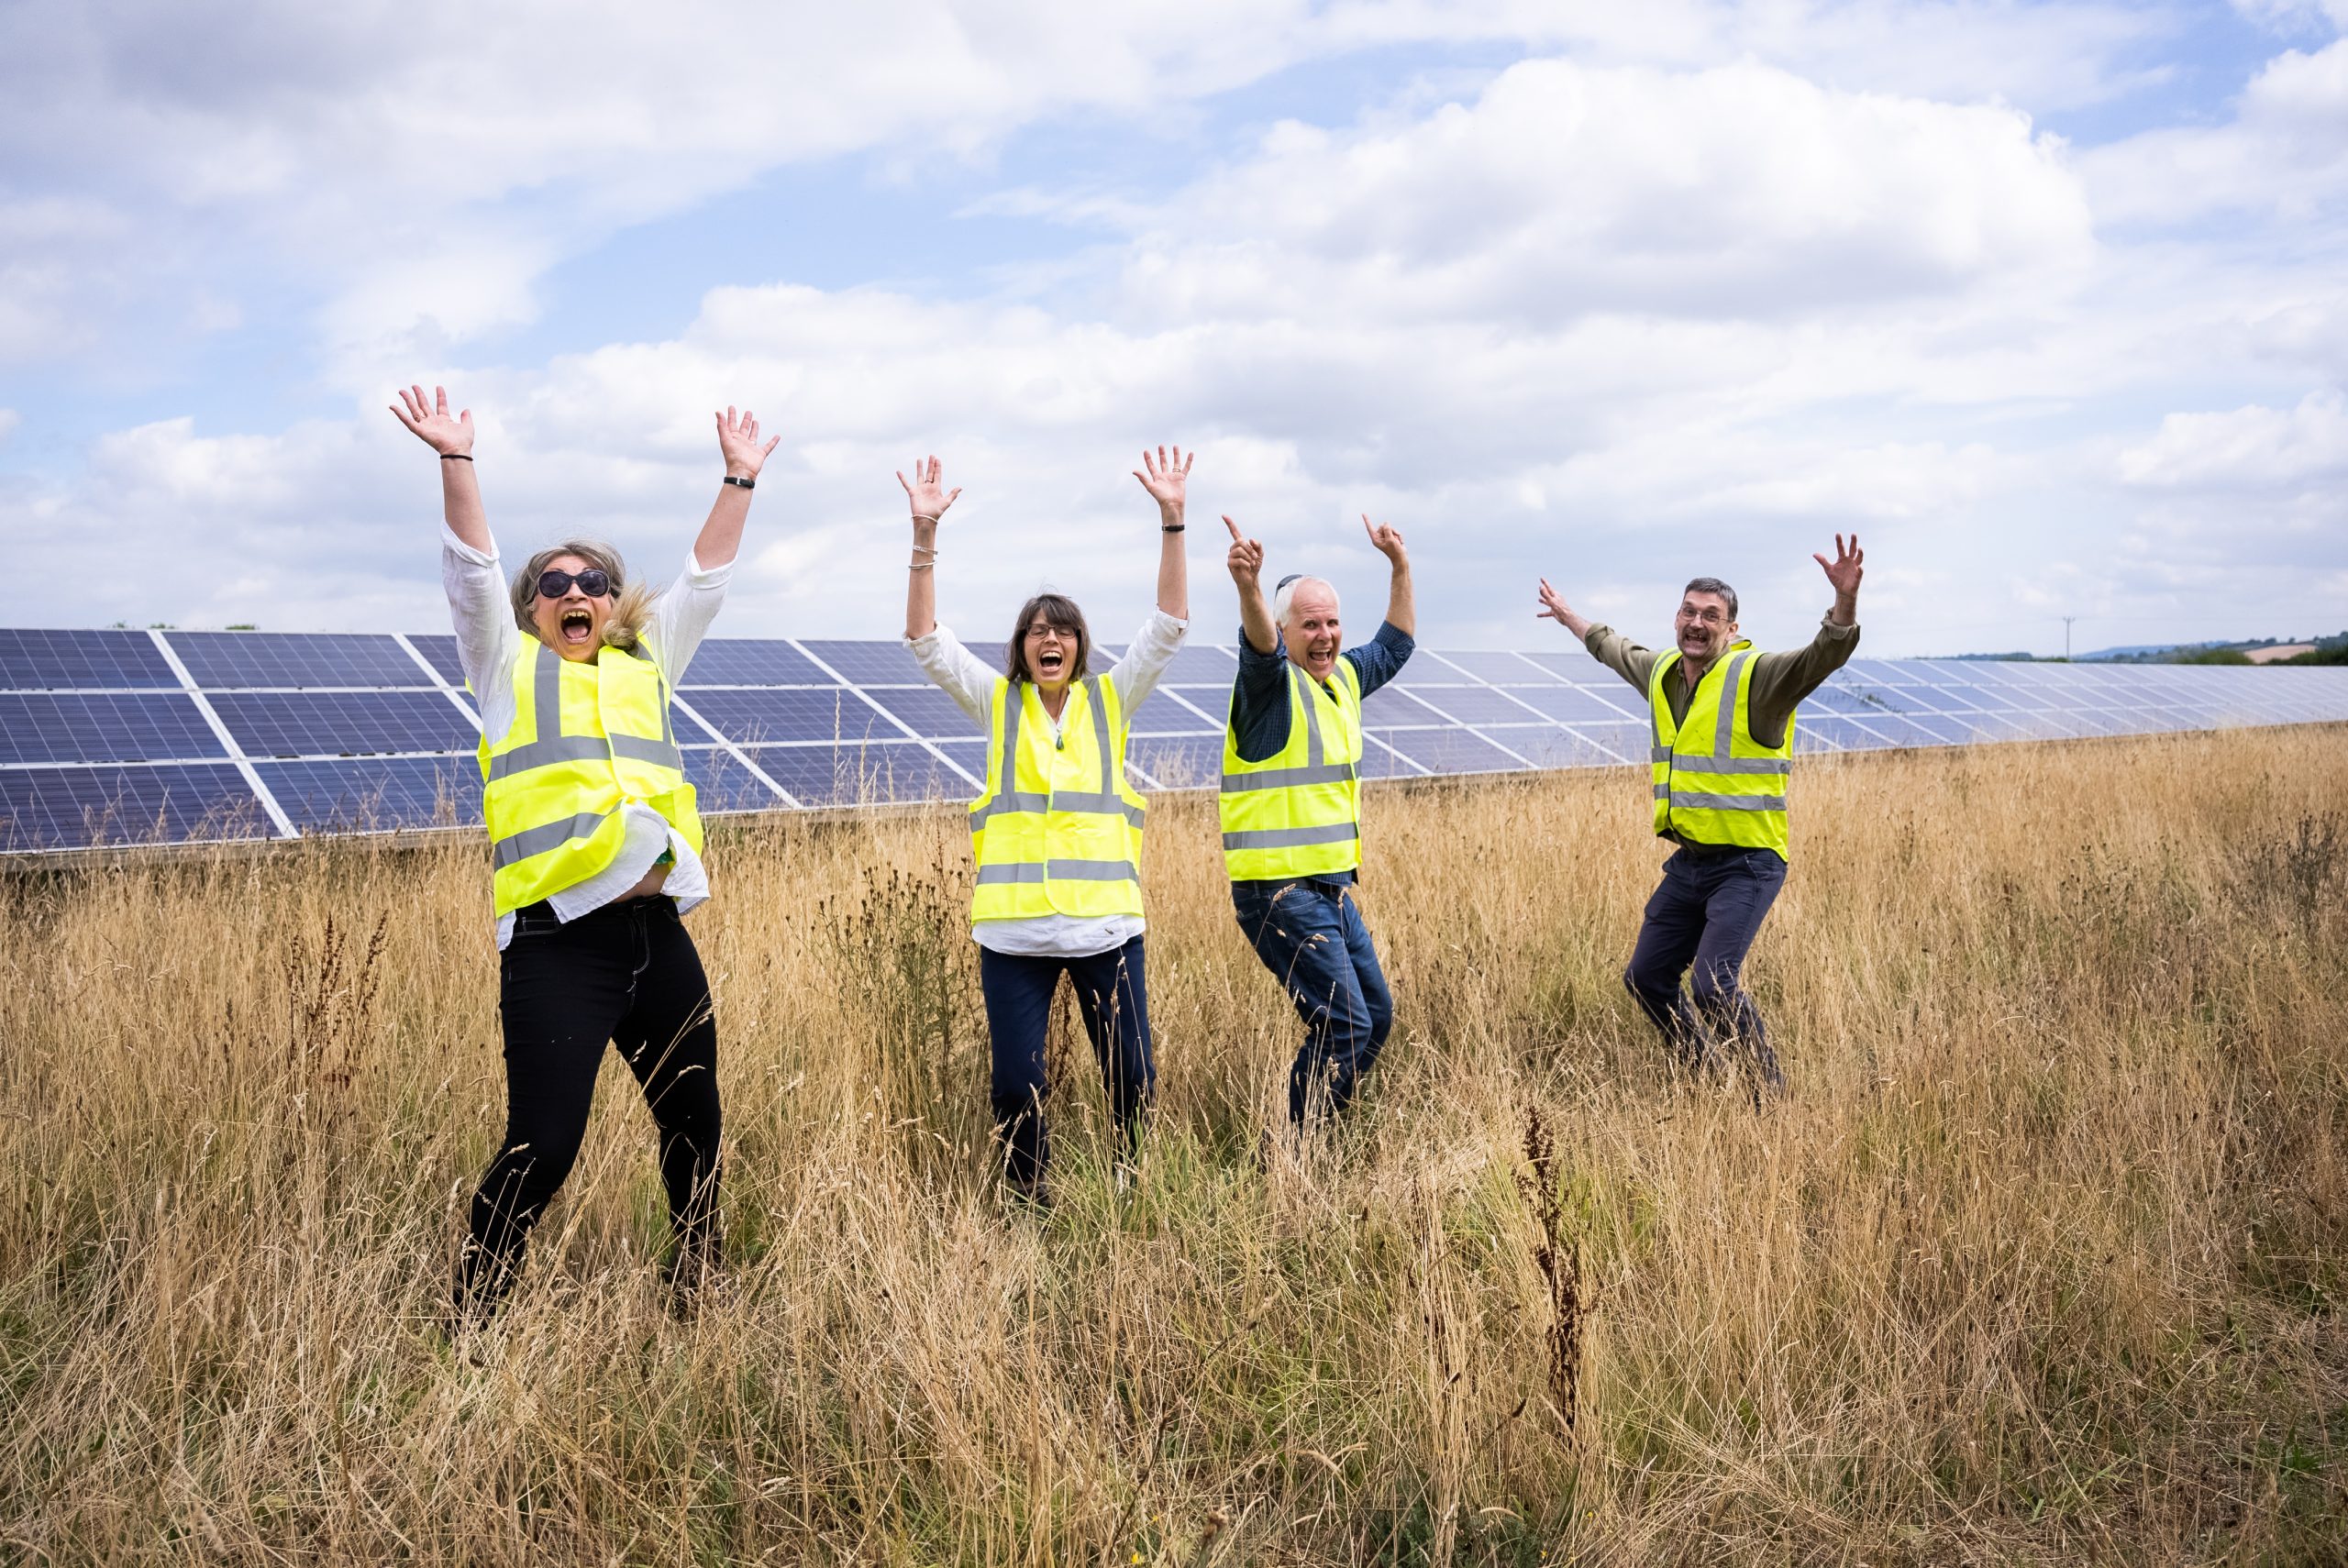
Our total installed capacity grew to 13.37MW with the addition of 780kW of rooftop solar across 7 schools. By the end of March 2023 we had generated enough electricity during the year to meet the equivalent annual demand from nearly 4,500 typical households*. Our projects performed OK across the whole portfolio at just below target for the whole year.
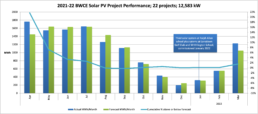
BWCE Projects 2021-22
Our total installed capacity grew to 12.58MW. By the end of March 2022 we had generated enough electricity during the year to meet the equivalent annual demand from nearly 4,200 typical households*. Our projects performed well with performance across the whole portfolio around 1.5% above target for the whole year.
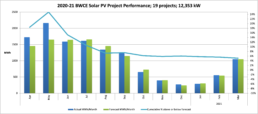
BWCE Projects 2020-21
There was no further growth in project capacity this year. Our total installed capacity remains at 12.35MW. By the end of March 2021 we had generated enough electricity during the year to meet the equivalent annual demand from 4,500 typical households*. Our projects performed very well with performance across the whole portfolio just over 5% above target for the whole year.
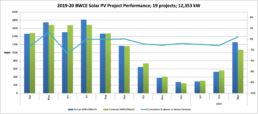
BWCE Projects 2019-20
There was no further growth in project capacity this year. Our total installed capacity remains at 12.35MW. By the end of March 2020 we had generated enough electricity during the year to meet the equivalent annual demand from nearly 4,000 typical households*. Our projects performed well with performance across the whole portfolio just above target for the whole year.
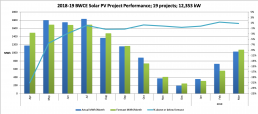
BWCE Projects 2018-19
There was no further growth in project capacity this year. Our total installed capacity remains at 12.35MW. By the end of March 2019 we had generated enough electricity during the year to meet the equivalent annual demand from over 4,000 typical households*. As a result of better year in terms of sunshine levels our projects exceeded their forecast yield with just under 1% above target.
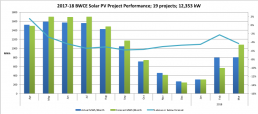
BWCE Projects 2017-18
There was no further growth in project capacity this year. Our total installed capacity remains at 12.35MW. By the end of March 2018 we had generated enough electricity during the year to meet the equivalent annual demand from nearly 4,000 typical households*. Primarily because of lower than average levels of sunshine during the summer months, for the second year running, our projects were just over 4% below target. Click here for more analysis of the reasons behind this year’s project performance.
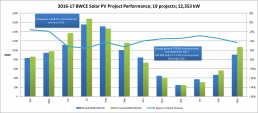
BWCE Projects 2016-17
Further project growth this year with the commissioning of the Crewkerne (4.99MW) and Stowey Ground (250kW) solar arrays as well as our first hydro scheme, a lovely modern waterwheel at Old Mill Hotel. Our total installed capacity is now at 12.35 MW. By the end of March 2017 we had generated enough electricity during the year to meet the equivalent annual demand from nearly 3,300 typical households*. Primarily because of lower than average levels of sunshine during the summer months our projects were 5% below target. Click here for more analysis of the reasons behind this year’s project performance.
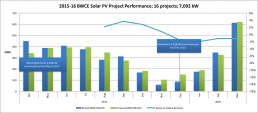
BWCE Projects 2015-16
Massive and exciting developments this year with the commissioning of both Wilmington (2.34MW) and Portworthy (4.02MW) solar arrays, bringing our total installed capacity up to nearly 7.1MW. By the end of March 2016 we had generated enough electricity during the year to meet the equivalent annual demand from over 1,000 typical households*, finishing the year around target. If our current capacity operated for a full year we would generate enough electricity to meet the equivalent annual demand from 2,150 typical households*.
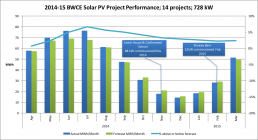
BWCE Projects 2014-15
Major development work underway on our first large solar array at Wilmington farm with construction just completing before the end of the year. During the year three new roof mounted projects were also installed including on the council offices at Lewis House, with iconic views over to the abbey. By the end of March 2015 we had generated enough electricity during the year to meet the equivalent annual demand from nearly 160 typical households*, finishing the year around 2.5% above target.
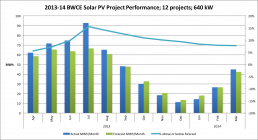
BWCE Projects 2013-14
Main focus of the year has been the development of partnerships with Low Carbon Gordano and Wiltshire Wildlife Community Energy and the construction of Wiltshire Wildlife Community Energy’s 1MW solar array next to one of their nature reserves at Chelworth. By the end of March 2014 we had generated enough electricity during the year to meet the equivalent annual demand from 160 typical households*, finishing the year around 8% above target.
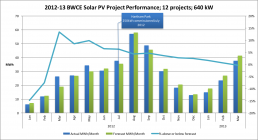
BWCE Projects 2012-13
Our first full year of operation coincided with very low levels of solar irradiation during key summer months. But we installed our first ground mounted array, a 250kW system linked to Hartham Business Park. By the end of March 2013 we had generated enough electricity during the year to meet the equivalent annual demand from 130 typical households*, finishing the year just on target.
These projects do not include the range of projects, both large and small, that BWCE has supported other community enterprises to develop and commission. See here for a summary of all the projects BWCE has been involved with.
*Assuming up until 2019-20 a typical UK household (without economy 7) consumes 3100 kWh of electricity per year, based on Ofgem data. See here for link. For the years following 2019-20 Ofgem have reduced the figure to 2900 kWh of electricity demand per year for a typical UK household (without economy 7).